3. Housekeeping Calibration#
This section describes the calibration of the non-science data values such as housekeeping data.
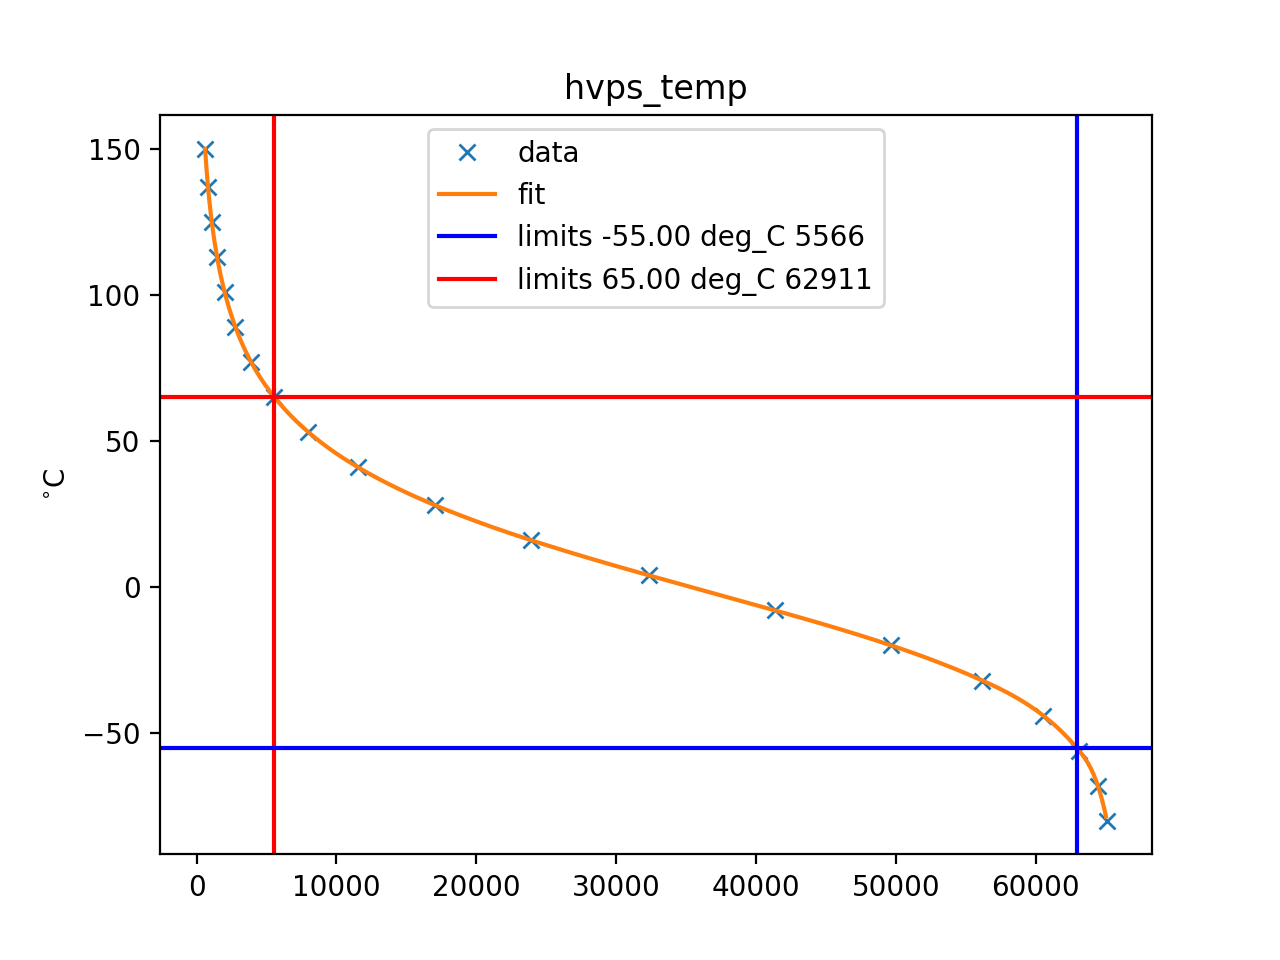
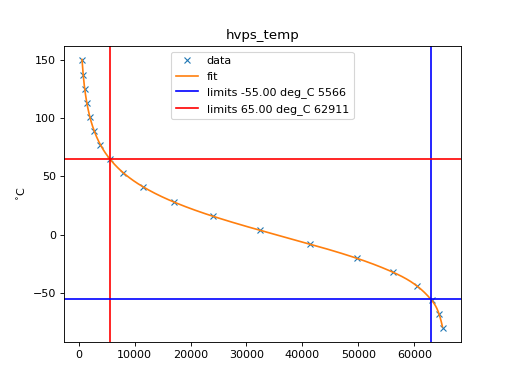
3.1. hvps_temp#
The temperature of the High Voltage Power supply.
import numpy as np
import matplotlib.pyplot as plt
from astropy.visualization import quantity_support
import astropy.units as u

quantity_support()

hk_name = "hvps_temp"

import padre_meddea.housekeeping.calibration as calib_hk
from padre_meddea.housekeeping.housekeeping import hk_definitions

data = calib_hk.get_calibration_data(hk_name)

low_limit = u.Quantity(
   hk_definitions.loc[hk_name]["low_limit"], hk_definitions.loc[hk_name]["unit_str"]
)
high_limit = u.Quantity(
   hk_definitions.loc[hk_name]["high_limit"], hk_definitions.loc[hk_name]["unit_str"]
)

adc_low = calib_hk.inverse_calibrate(hk_name, low_limit)[0]
adc_high = calib_hk.inverse_calibrate(hk_name, high_limit)[0]

f = calib_hk.get_calibration_func(hk_name)
fit_x = np.arange(data["adc"].min(), data["adc"].max(), 100)

plt.plot(data["adc"], data["value"], "x", label="data")
plt.plot(fit_x, f(fit_x), label="fit")
plt.axvline(adc_low, color="blue")
plt.axvline(adc_high, color="red")
plt.axhline(low_limit, label=f"limits {low_limit:0.2f} {adc_high:0.0f}", color="blue")
plt.axhline(high_limit, label=f"limits {high_limit:0.2f} {adc_low:0.0f}", color="red")
plt.title(hk_name)
plt.legend()
(Source code, png, hires.png, pdf)
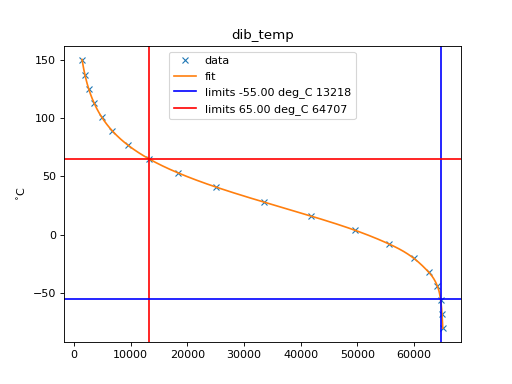
3.2. dib_temp#
The temperature of the Detector Interface Board (DIB).
import numpy as np
import matplotlib.pyplot as plt
from astropy.visualization import quantity_support
import astropy.units as u

quantity_support()

hk_name = "dib_temp"

import padre_meddea.housekeeping.calibration as calib_hk
from padre_meddea.housekeeping.housekeeping import hk_definitions

data = calib_hk.get_calibration_data(hk_name)

low_limit = u.Quantity(
   hk_definitions.loc[hk_name]["low_limit"], hk_definitions.loc[hk_name]["unit_str"]
)
high_limit = u.Quantity(
   hk_definitions.loc[hk_name]["high_limit"], hk_definitions.loc[hk_name]["unit_str"]
)

adc_low = calib_hk.inverse_calibrate(hk_name, low_limit)[0]
adc_high = calib_hk.inverse_calibrate(hk_name, high_limit)[0]

f = calib_hk.get_calibration_func(hk_name)
fit_x = np.arange(data["adc"].min(), data["adc"].max(), 100)

plt.plot(data["adc"], data["value"], "x", label="data")
plt.plot(fit_x, f(fit_x), label="fit")
plt.axvline(adc_low, color="blue")
plt.axvline(adc_high, color="red")
plt.axhline(low_limit, label=f"limits {low_limit:0.2f} {adc_high:0.0f}", color="blue")
plt.axhline(high_limit, label=f"limits {high_limit:0.2f} {adc_low:0.0f}", color="red")
plt.title(hk_name)
plt.legend()
(Source code, png, hires.png, pdf)

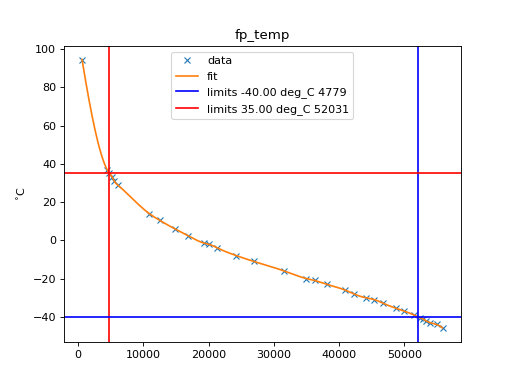
3.3. fp_temp#
The temperature of the focal or detector plane.
import numpy as np
import matplotlib.pyplot as plt
from astropy.visualization import quantity_support
import astropy.units as u

quantity_support()

hk_name = "fp_temp"

import padre_meddea.housekeeping.calibration as calib_hk
from padre_meddea.housekeeping.housekeeping import hk_definitions

data = calib_hk.get_calibration_data(hk_name)

low_limit = u.Quantity(
   hk_definitions.loc[hk_name]["low_limit"], hk_definitions.loc[hk_name]["unit_str"]
)
high_limit = u.Quantity(
   hk_definitions.loc[hk_name]["high_limit"], hk_definitions.loc[hk_name]["unit_str"]
)

adc_low = calib_hk.inverse_calibrate(hk_name, low_limit)[0]
adc_high = calib_hk.inverse_calibrate(hk_name, high_limit)[0]

f = calib_hk.get_calibration_func(hk_name)
fit_x = np.arange(data["adc"].min(), data["adc"].max(), 100)

plt.plot(data["adc"], data["value"], "x", label="data")
plt.plot(fit_x, f(fit_x), label="fit")
plt.axvline(adc_low, color="blue")
plt.axvline(adc_high, color="red")
plt.axhline(low_limit, label=f"limits {low_limit:0.2f} {adc_high:0.0f}", color="blue")
plt.axhline(high_limit, label=f"limits {high_limit:0.2f} {adc_low:0.0f}", color="red")
plt.title(hk_name)
plt.legend()
(Source code, png, hires.png, pdf)

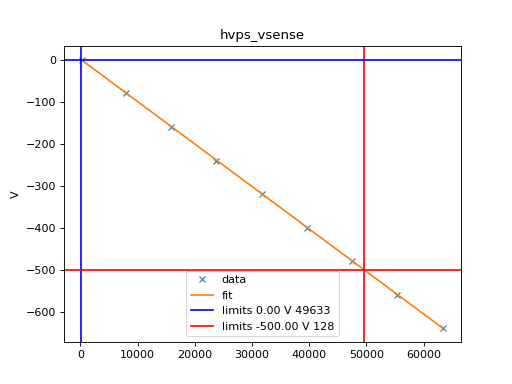
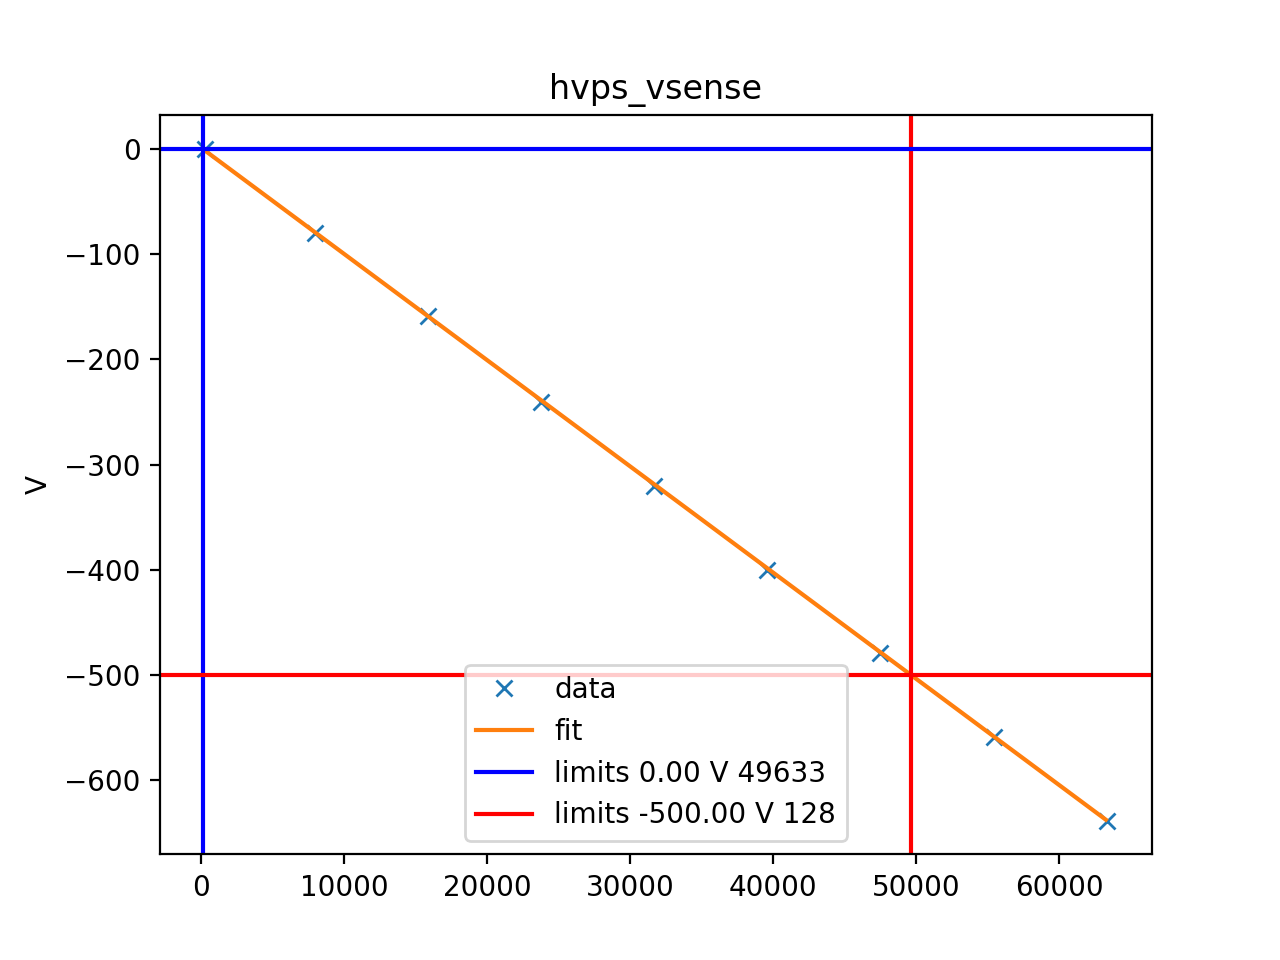
3.4. hvps_vsense#
import numpy as np
import matplotlib.pyplot as plt
from astropy.visualization import quantity_support
import astropy.units as u

quantity_support()

hk_name = "hvps_vsense"

import padre_meddea.housekeeping.calibration as calib_hk
from padre_meddea.housekeeping.housekeeping import hk_definitions

data = calib_hk.get_calibration_data(hk_name)

low_limit = u.Quantity(
   hk_definitions.loc[hk_name]["low_limit"], hk_definitions.loc[hk_name]["unit_str"]
)
high_limit = u.Quantity(
   hk_definitions.loc[hk_name]["high_limit"], hk_definitions.loc[hk_name]["unit_str"]
)

adc_low = calib_hk.inverse_calibrate(hk_name, low_limit)[0]
adc_high = calib_hk.inverse_calibrate(hk_name, high_limit)[0]

f = calib_hk.get_calibration_func(hk_name)
fit_x = np.arange(data["adc"].min(), data["adc"].max(), 100)

plt.plot(data["adc"], data["value"], "x", label="data")
plt.plot(fit_x, f(fit_x), label="fit")
plt.axvline(adc_low, color="blue")
plt.axvline(adc_high, color="red")
plt.axhline(low_limit, label=f"limits {low_limit:0.2f} {adc_high:0.0f}", color="blue")
plt.axhline(high_limit, label=f"limits {high_limit:0.2f} {adc_low:0.0f}", color="red")
plt.title(hk_name)
plt.legend()
(Source code, png, hires.png, pdf)

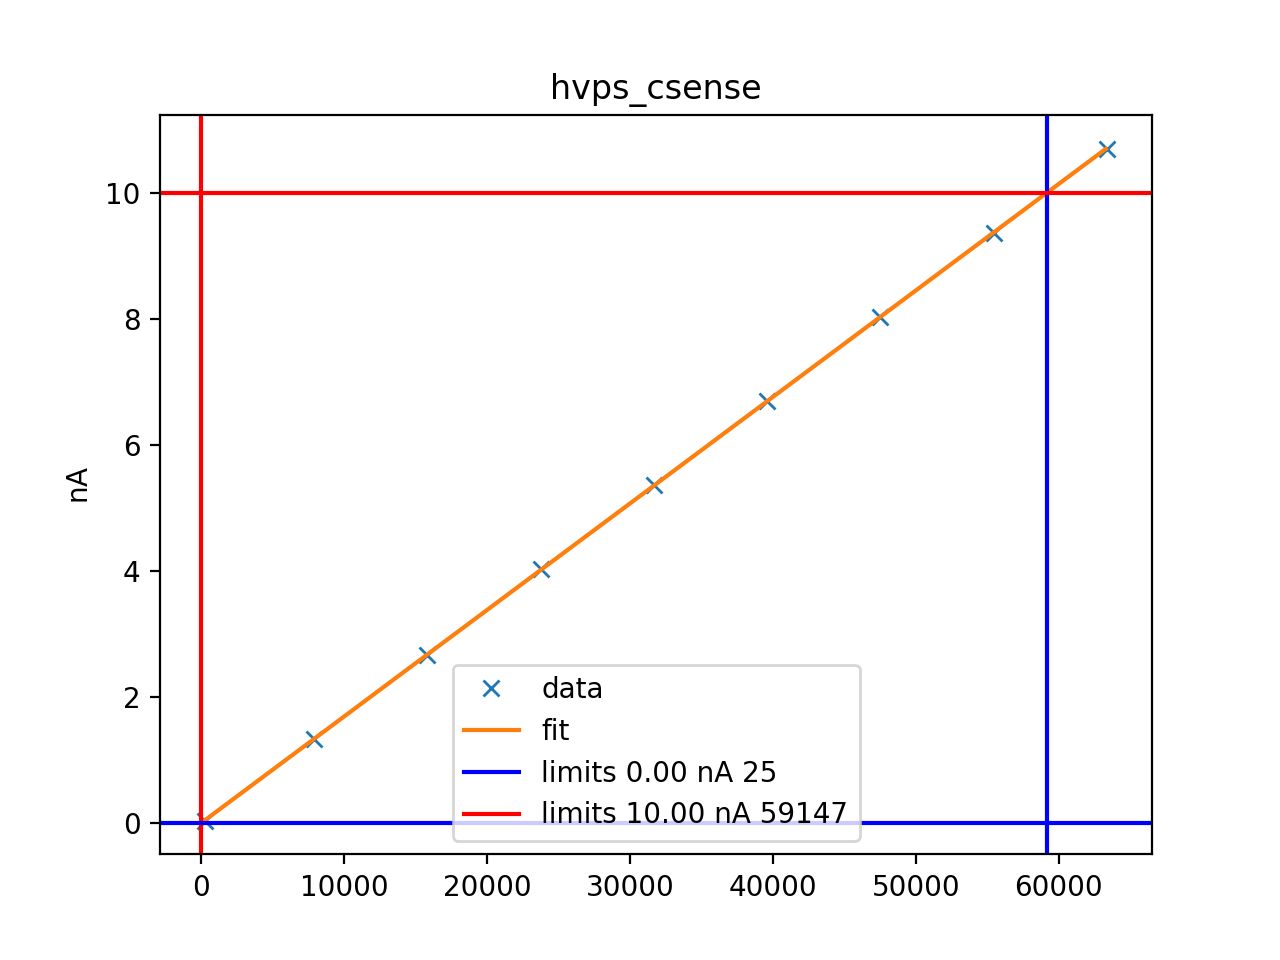
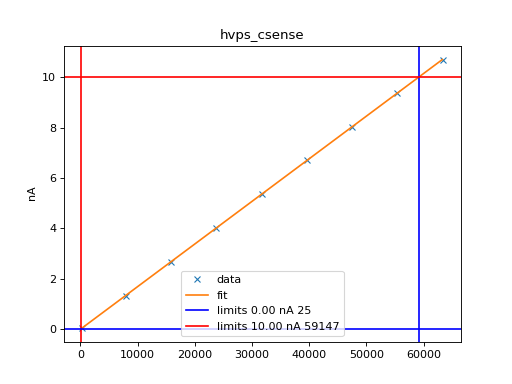
3.5. hvps_csense#
import numpy as np
import matplotlib.pyplot as plt
from astropy.visualization import quantity_support
import astropy.units as u

quantity_support()

hk_name = "hvps_csense"

import padre_meddea.housekeeping.calibration as calib_hk
from padre_meddea.housekeeping.housekeeping import hk_definitions

data = calib_hk.get_calibration_data(hk_name)

low_limit = u.Quantity(
   hk_definitions.loc[hk_name]["low_limit"], hk_definitions.loc[hk_name]["unit_str"]
)
high_limit = u.Quantity(
   hk_definitions.loc[hk_name]["high_limit"], hk_definitions.loc[hk_name]["unit_str"]
)

adc_low = calib_hk.inverse_calibrate(hk_name, low_limit)[0]
adc_high = calib_hk.inverse_calibrate(hk_name, high_limit)[0]

f = calib_hk.get_calibration_func(hk_name)
fit_x = np.arange(data["adc"].min(), data["adc"].max(), 100)

plt.plot(data["adc"], data["value"], "x", label="data")
plt.plot(fit_x, f(fit_x), label="fit")
plt.axvline(adc_high, color="blue")
plt.axvline(adc_low, color="red")
plt.axhline(low_limit, label=f"limits {low_limit:0.2f} {adc_low:0.0f}", color="blue")
plt.axhline(high_limit, label=f"limits {high_limit:0.2f} {adc_high:0.0f}", color="red")
plt.title(hk_name)
plt.legend()
(Source code, png, hires.png, pdf)
3.6. csense_15v#
import numpy as np
import matplotlib.pyplot as plt
from astropy.visualization import quantity_support
import astropy.units as u

quantity_support()

hk_name = "csense_15v"

import padre_meddea.housekeeping.calibration as calib_hk
from padre_meddea.housekeeping.housekeeping import hk_definitions

data = calib_hk.get_calibration_data(hk_name)

low_limit = u.Quantity(
   hk_definitions.loc[hk_name]["low_limit"], hk_definitions.loc[hk_name]["unit_str"]
)
high_limit = u.Quantity(
   hk_definitions.loc[hk_name]["high_limit"], hk_definitions.loc[hk_name]["unit_str"]
)

adc_low = calib_hk.inverse_calibrate(hk_name, low_limit)[0]
adc_high = calib_hk.inverse_calibrate(hk_name, high_limit)[0]

f = calib_hk.get_calibration_func(hk_name)
fit_x = np.arange(data["adc"].min(), data["adc"].max(), 100)

plt.plot(data["adc"], data["value"], "x", label="data")
plt.plot(fit_x, f(fit_x), label="fit")
plt.axvline(adc_low, color="blue")
plt.axvline(adc_high, color="red")
plt.axhline(low_limit, label=f"limits {low_limit:0.2f} {adc_high:0.0f}", color="blue")
plt.axhline(high_limit, label=f"limits {high_limit:0.2f} {adc_low:0.0f}", color="red")
plt.title(hk_name)
plt.legend()
(Source code, png, hires.png, pdf)

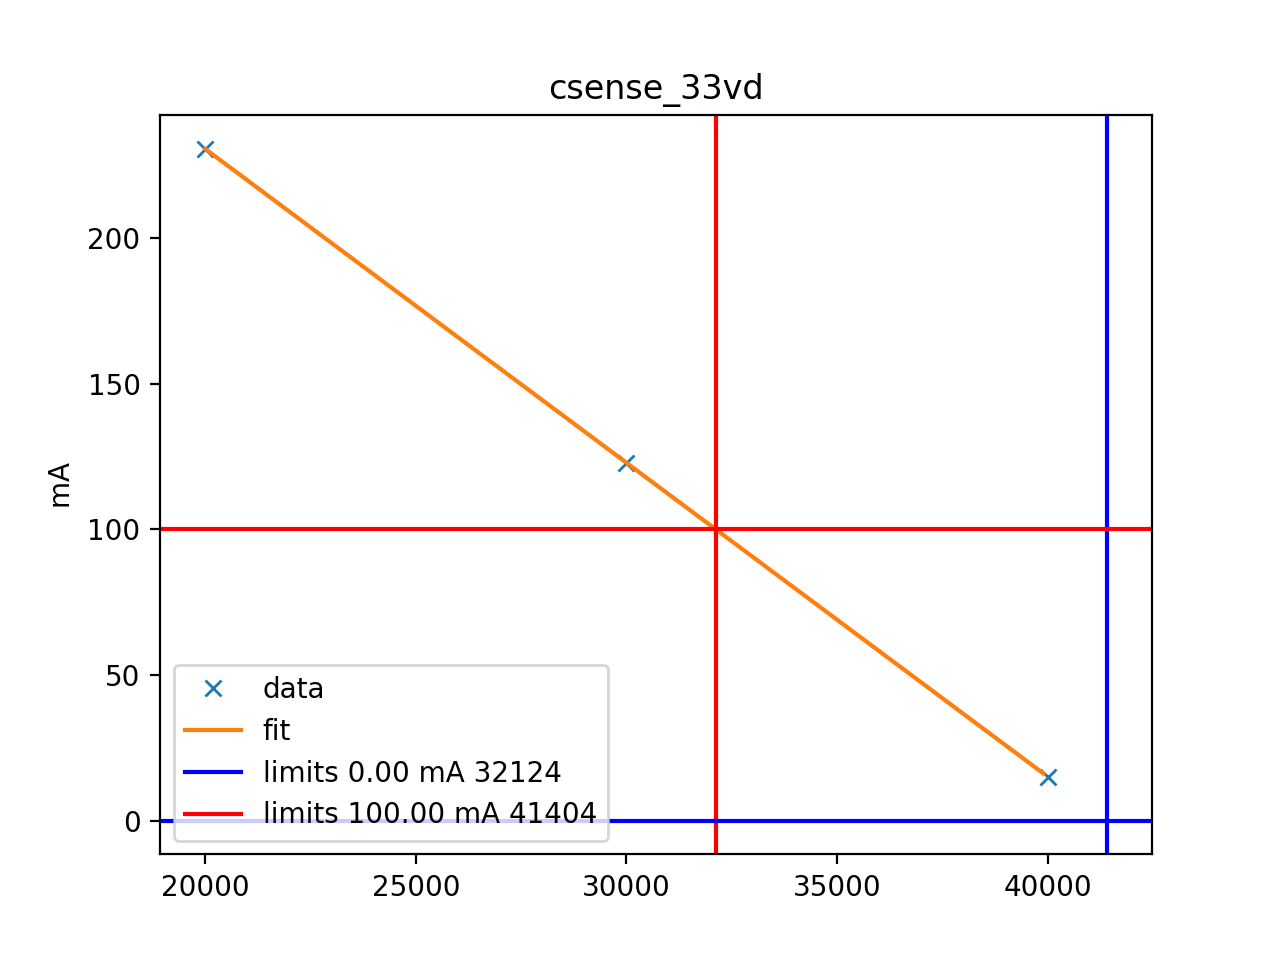
3.7. csense_33vd#
import numpy as np
import matplotlib.pyplot as plt
from astropy.visualization import quantity_support
import astropy.units as u

quantity_support()

hk_name = "csense_33vd"

import padre_meddea.housekeeping.calibration as calib_hk
from padre_meddea.housekeeping.housekeeping import hk_definitions

data = calib_hk.get_calibration_data(hk_name)

low_limit = u.Quantity(
   hk_definitions.loc[hk_name]["low_limit"], hk_definitions.loc[hk_name]["unit_str"]
)
high_limit = u.Quantity(
   hk_definitions.loc[hk_name]["high_limit"], hk_definitions.loc[hk_name]["unit_str"]
)

adc_low = calib_hk.inverse_calibrate(hk_name, low_limit)[0]
adc_high = calib_hk.inverse_calibrate(hk_name, high_limit)[0]

f = calib_hk.get_calibration_func(hk_name)
fit_x = np.arange(data["adc"].min(), data["adc"].max(), 100)

plt.plot(data["adc"], data["value"], "x", label="data")
plt.plot(fit_x, f(fit_x), label="fit")
plt.axvline(adc_low, color="blue")
plt.axvline(adc_high, color="red")
plt.axhline(low_limit, label=f"limits {low_limit:0.2f} {adc_high:0.0f}", color="blue")
plt.axhline(high_limit, label=f"limits {high_limit:0.2f} {adc_low:0.0f}", color="red")
plt.title(hk_name)
plt.legend()
(Source code, png, hires.png, pdf)

3.8. csense_33va#
import numpy as np
import matplotlib.pyplot as plt
from astropy.visualization import quantity_support
import astropy.units as u

quantity_support()

hk_name = "csense_33va"

import padre_meddea.housekeeping.calibration as calib_hk
from padre_meddea.housekeeping.housekeeping import hk_definitions

data = calib_hk.get_calibration_data(hk_name)

low_limit = u.Quantity(
   hk_definitions.loc[hk_name]["low_limit"], hk_definitions.loc[hk_name]["unit_str"]
)
high_limit = u.Quantity(
   hk_definitions.loc[hk_name]["high_limit"], hk_definitions.loc[hk_name]["unit_str"]
)

adc_low = calib_hk.inverse_calibrate(hk_name, low_limit)[0]
adc_high = calib_hk.inverse_calibrate(hk_name, high_limit)[0]

f = calib_hk.get_calibration_func(hk_name)
fit_x = np.arange(data["adc"].min(), data["adc"].max(), 100)

plt.plot(data["adc"], data["value"], "x", label="data")
plt.plot(fit_x, f(fit_x), label="fit")
plt.axvline(adc_low, color="blue")
plt.axvline(adc_high, color="red")
plt.axhline(low_limit, label=f"limits {low_limit:0.2f} {adc_high:0.0f}", color="blue")
plt.axhline(high_limit, label=f"limits {high_limit:0.2f} {adc_low:0.0f}", color="red")
plt.title(hk_name)
plt.legend()
(Source code, png, hires.png, pdf)

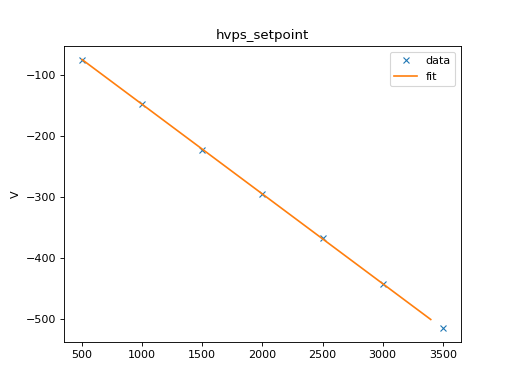
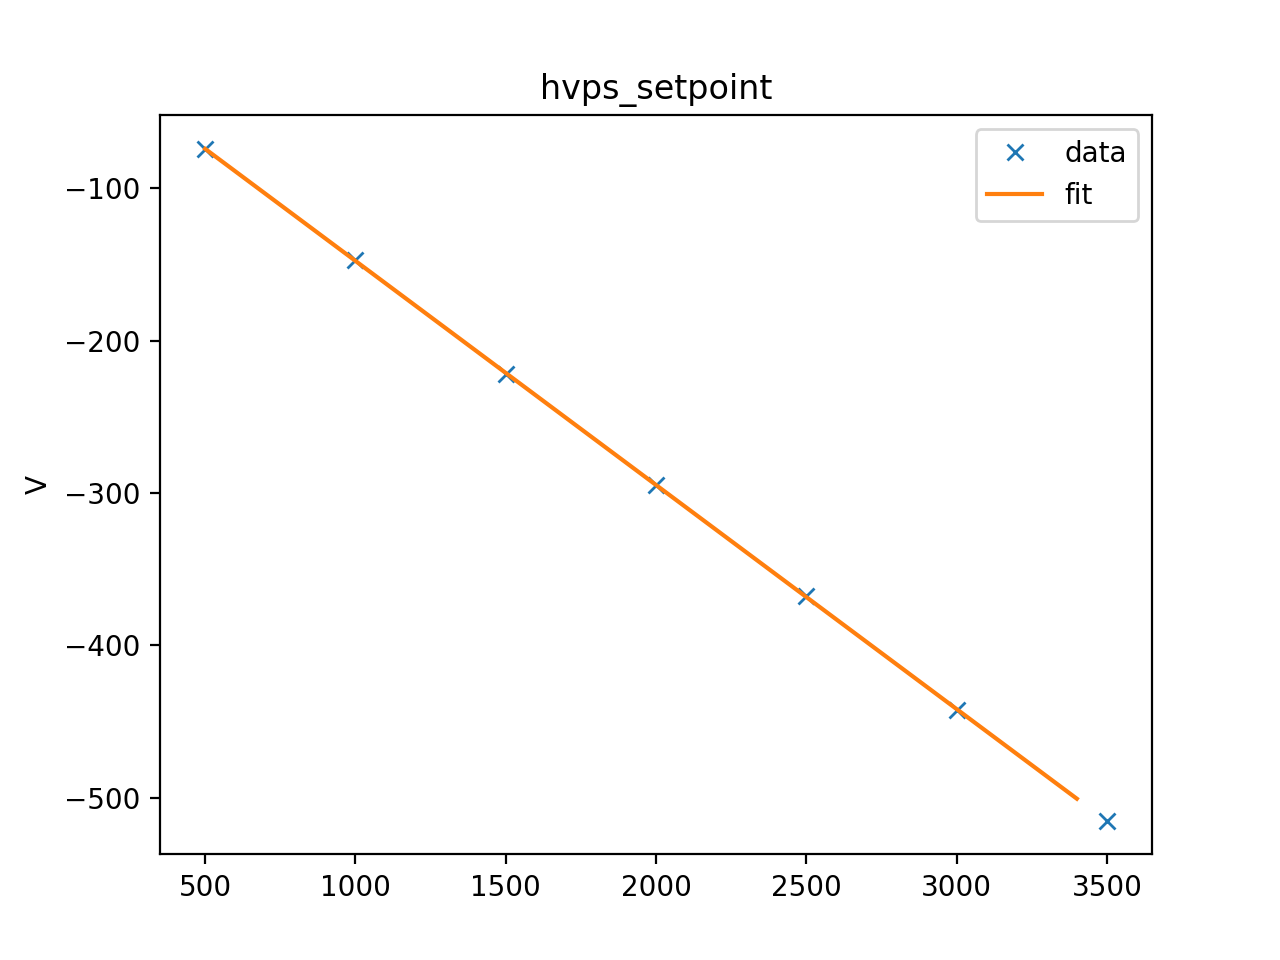
3.9. hvps_setpoint#
import numpy as np
import matplotlib.pyplot as plt
from astropy.visualization import quantity_support
import astropy.units as u

quantity_support()

hk_name = "hvps_setpoint"

import padre_meddea.housekeeping.calibration as calib_hk

data = calib_hk.get_calibration_data(hk_name)

f = calib_hk.get_calibration_func(hk_name)
fit_x = np.arange(data["adc"].min(), data["adc"].max(), 100)

plt.plot(data["adc"], data["value"], "x", label="data")
plt.plot(fit_x, f(fit_x), label="fit")
plt.title(hk_name)
plt.legend()
(Source code, png, hires.png, pdf)
